使用TheGraph开发链上数据索引的一些总结

映射部分

  • 变量命名的坑:这个问题主要出在GraphQL上,graph在查询数据时,对于多条数据查询需要将查询的entity变成复数形式,所以在命名entity时最好需要避开结尾是s,es等情况。

  • 数据类型映射的问题:The Graph中的基础类型如下图,可以通过定义entity以及entity Array的形式得到任何复杂类型,文档中对于Int类型占用32个字节的说法存疑,BigDecimal可以保存浮点数,并且精度很高

  • 数据运算:对于Int,BigInt,BigDecimal等数据,graph已经完成了对这些数据类型的运算符的重载,具体支持的计算类型如下:
1
2
3
4
5
6
7
8
9
10
11
12
13
14
export declare namespace bigInt {
function plus(x: BigInt, y: BigInt): BigInt // +
function minus(x: BigInt, y: BigInt): BigInt // -
function times(x: BigInt, y: BigInt): BigInt // *
function dividedBy(x: BigInt, y: BigInt): BigInt // /
function dividedByDecimal(x: BigInt, y: BigDecimal): BigDecimal
function mod(x: BigInt, y: BigInt): BigInt // %
function pow(x: BigInt, exp: u8): BigInt
function fromString(s: string): BigInt
function bitOr(x: BigInt, y: BigInt): BigInt // |
function bitAnd(x: BigInt, y: BigInt): BigInt // &
function leftShift(x: BigInt, bits: u8): BigInt // ><<
function rightShift(x: BigInt, bits: u8): BigInt // >>
}
  • 关于entity的Array:graph的ArrayList本质上是一个string数组,里面保存的是目标entity的id,因此使用起来较为方便,在向Array作增量更新时直接使用array.push[entity]这种形式是无效的,需要将array原本的内容深拷贝一份后再添加元素,最后进行覆盖才是有效的。
1
2
3
4
5
6
// 正确用法:
let fromUser = getOrInitUser(oldOwnerId);
let temp = fromUser.transferedOut!;
temp.push(receiptHash);
fromUser.transferedOut = temp;
fromUser.save();
  • 谨慎使用const:在graph的处理中需要谨慎使用const,如果你可以确保你的graph在进行索引时只会使用到某些同名变量的一次,那么可以使用const,否则还是最好使用let或者var

  • 关于handle的粒度:graph支持在receipt层和block层处理索引,需要注意的是跨合约调用的日志会分布在不同的receipt中,需要获取这些日志时,需要指定每个receipt中的函数名,下图是发生在一个区块中不同receipt的案例

    1
    2
    3
    4
    blockHandlers:
    - handler: handleNewBlock # the function name in the mapping file
    receiptHandlers:
    - handler: handleReceipt # the function name in the mapping file
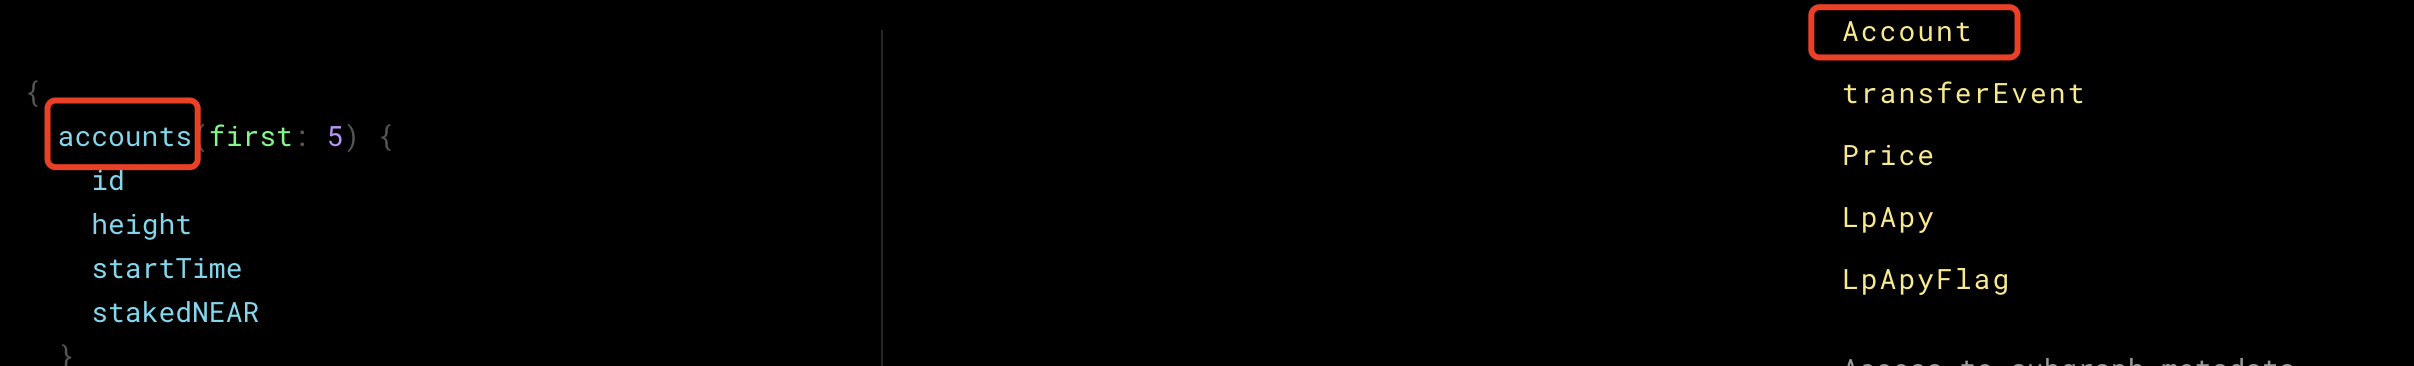
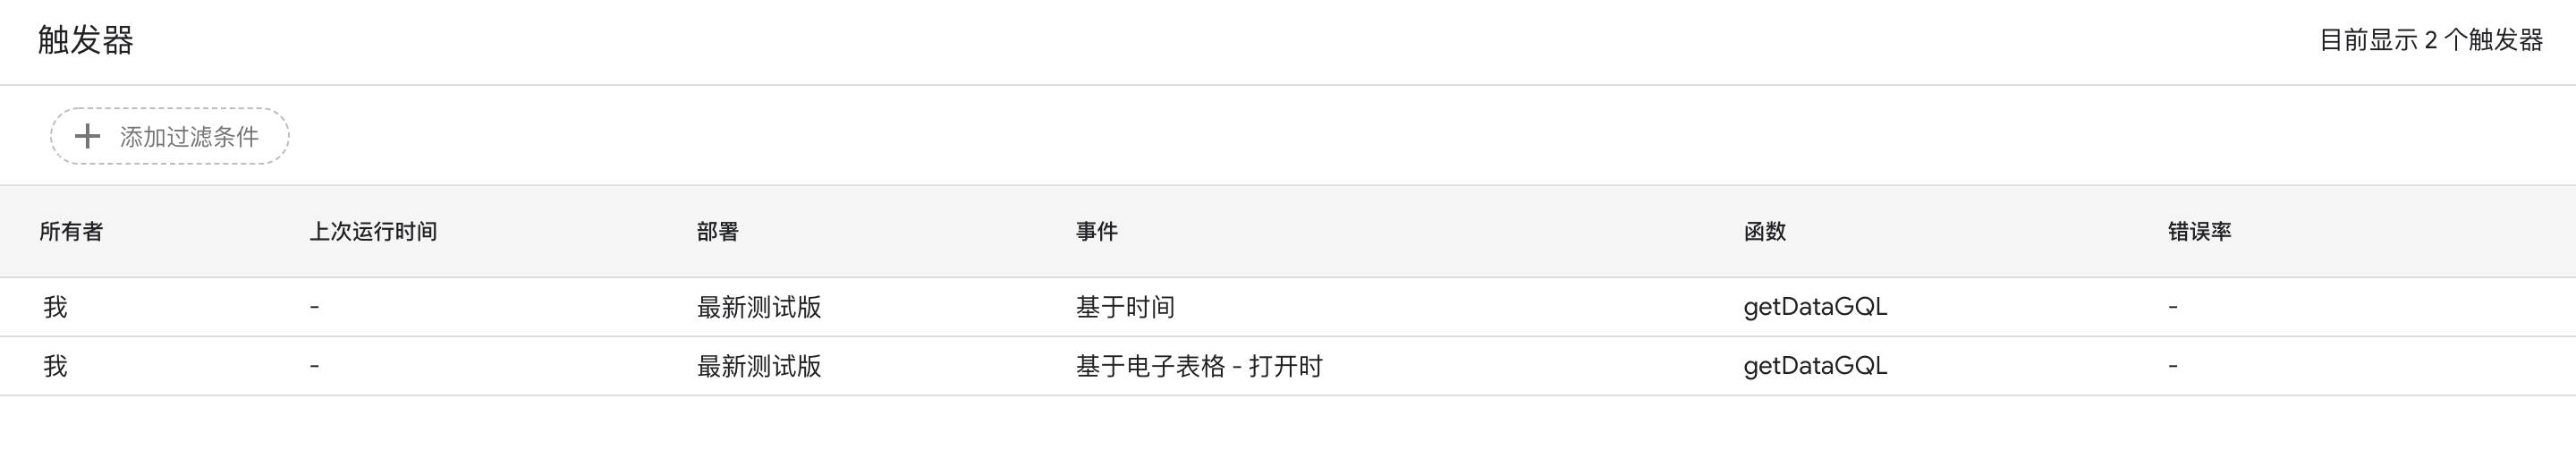
  • 关于timeStamp:graph中的timeStamp是从区块中获取的而不是直接获取系统时间戳,这一点需要注意

  • 关于id选取的一些经验:id是graph的entity中最重要的一个字段,一般来说需要索引的数据会离散的分布在不同的区块中,因此想要避免重复的id可以使用blockHash或者timeStamp,关于实现连续的id再下文中会介绍,下面是区块中的一些unique的信息,可以用来作为id,对于其中bytes类型的数据可以使用graph库中自带的base58编码后即可去浏览器中查询

base58编码后的receiptHash

1
2
3
4
5
6
7
8
9
10
11
12
13
14
15
16
17
18
// block级
class BlockHeader {
height: u64,
epochId: Bytes,
hash: Bytes,
timestampNanosec: u64,
}

// receipt级
class ExecutionOutcome {
gasBurnt: u64,
blockHash: Bytes,
id: Bytes,
logs: Array<string>,
receiptIds: Array<Bytes>,
tokensBurnt: BigInt,
executorId: string,
}
  • 关于实现连续id:对于一些特殊的需求,比如说维护一个值的增长的全过程,此时就需要找到上一条记录的id,这种情况下可以用一个version结构去记录上一条记录的id,并且保存下一条记录的id,这种结构类似于链表,下面是一个最简单的version的实现:
1
2
3
4
priceVersion.lastPriceID = priceVersion.nextPriceID;
priceVersion.nextPriceID = priceVersion.nextPriceID.plus(BigInt.fromU32(1));
priceVersion.latestPrice = nextPrice.price;
priceVersion.save();
  • 关于反向查询的一些思考和理解:反向查询本事上是在结构中加入一些虚拟的字段,通过这些字段可以进行反向查询,以NFT场景为例,某些地方需要查询NFT的所属者以及一个用户所持有的全部NFT,这种情况反向查询就显得格外有用,以superise的graph中的反向查询为例,可以这样理解,Array代表了一对多的映射,反向查询则可以代表了多对多的双向映射,完整代码可以在superise的graph仓库中找到
1
2
3
4
5
6
7
8
9
10
11
12
13
14
15
16
17
18
19
20
21
22
23
24
25
26
27
28
29
30
31
32
type TwitterPool @entity{
id: ID!
name: String!
describe: String!
cover: String!
status: String!
end_time: BigInt!
create_time: BigInt!
update_time: BigInt!
white_list: [Account!]
requirement: String
twitter_link: String!
winner_account: [Account!]
winner_record: [Record!]
creator_id: Account!
ft_prize: [FT!]
nft_prize: [NFT!]
join_account: [Account!]
}


type Account @entity{
id: ID!
name: String!
joined_prize_pool: [TwitterPool!] @derivedFrom(field: "join_account")
whitelist_pool: [TwitterPool!] @derivedFrom(field: "white_list")
created_pool: [TwitterPool!] @derivedFrom(field: "creator_id")
winned_pool: [TwitterPool!] @derivedFrom(field: "winner_account")
winned_prize: [Record!] @derivedFrom(field: "receiver")
sender_activity: [Activity!] @derivedFrom(field: "sender")
recevier_activity: [Activity!] @derivedFrom(field: "receiver")
}
  • 合约中对于event的定义与使用:这种需要结合具体情况具体分析,也许可以针对不同的NEP的标准编写一套对应的graph的模板,或者开发一个event2graph的小工具,其实关于这个问题我之前就有了一些思考,具体可以点击这里看关于event2graph的一些思考

  • 关于起始块的选择:通过在yaml文件中配置startBlock可以大大减少sync的耗时,但是如何选择一个起始块是一个比较有意思的问题,最严谨的方法就是使用浏览器查看account创建的时间,当然也可以选择合约发生第一笔交易的时间

部署部分

部署部分其实相对来说坑比较少,除了graph不定时抽风之外lol

  • pending与current version:这里要注意的是,当你试图重新覆盖掉已经sync完成的子图时,graph会自动创建一个pending版本,可以在playground的右上角进行版本的切换。

调试部分

关于graph的debug其实一直是一个比较麻烦的问题,重新部署+sync的耗时过长,下面还是有一些小技巧帮助你进行调试:

  • 在一些结构中加入blockHash或者receiptHash,可以去浏览器快速定位到问题区块

  • 如果你的graph不小心crash了,你可以在logs中找到出问题的区块高度,然后去分析其中的交易

  • 在编写graph时一定要构造一个比较严谨的闭合的生命周期,否则经常会出现一些数据对不上的情况

数据可视化部分

与Google Sheet、Google Data Studio 联动:这部分主要是把query的脚本改成了Google App Script,这里基于这个链接简单做了一个获取转账记录的脚本:

1
2
3
4
5
6
7
8
9
10
11
12
13
14
15
16
17
18
19
20
21
22
23
24
25
26
27
28
29
30
31
32
33
34
35
36
37
38
39
40
41
42
43
44
45
46
47
48
49
50
51
52
53
54
55
56
57
58
59
60
61
62
63
64
65
66
67
68
69
70
71
72
73
74
75
76
77
78
79
80
81
82
83
function getDataGQL() {
var url_query = 'https://api.thegraph.com/subgraphs/name/ha4a4ck/linearmainnet';

var query = `{
ftTransfers(first: 1000,skip: skip_param) {
to {
id
}
from {
id
}
timestamp
amount
}
}`

data = getApiData_(url_query, query)
writeData_(data)

}

/**
* Creates the query with the skip param to iterate all the borrows
* @param the query to executed with the skip param replaced
**/
function createOptions_(query){
var options = {
'method' : 'post',
'contentType': 'application/json',
'payload' : JSON.stringify({ query: query})
};
return options
}


/**
* Writes the data in the spreadsheet
* @param matrix data to write
**/
function writeData_(data){
Logger.log(data.length)
var ss = SpreadsheetApp.getActiveSpreadsheet().getActiveSheet();
ss.getRange(2, 1, data.length, data[0].length).clear()
ss.getRange(2, 1, data.length, data[0].length).setValues(data);
}


/**
* Gets the data from the api and transform the result
* getting the json data fields to a
* array to write in the spreadsheet
**/
function getApiData_(url_query, query){
var totalData = []
var areData = true
var skip = 0

while(areData){
var queryIter = query.replace("skip_param", skip.toString());
var options = createOptions_(queryIter)
var response = UrlFetchApp.fetch(url_query, options)
var json = response.getContentText();
var data = JSON.parse(json);
var arrayData = data['data']['ftTransfers']

var grouped = arrayData.map(function(e){
return [
e['amount'] / 1e24,
e['to']['id'],
e['from']['id'],
parseInt(e['timestamp'] / 1e6)
]
})

totalData.push(...grouped)
skip += 1000

areData = arrayData.length > 0
}

return totalData
}

然后定义好trigger

接着就可以去data studio尽情玩耍数据了,链接在这里:https://datastudio.google.com/reporting/6a034c50-3732-46d6-ab94-a7144fe2a816 ,后面看看怎么做一个有方向的动态图